By: Camilla Kaae Højgaard
Senior consultant at SEGES Innovation, Nutrition and Feeding,
Email: [email protected]
Abstract
SEGES Innovation has changed their recommendation for the backfat thickness of sows and gilts at farrowing from 16-19 to 14-17 mm based on a data analysis containing >3,900 sows and litters from 10 feeding trials run over the past 6 years.
The analysis shows that sows having 12-20 mm backfat at farrowing are high producing. Furthermore, the analysis shows that lean sows have less body weight and backfat losses during lactation. Thus, aiming at leaner sows will result in a reduced feed amount needed for restoring the optimal body condition in the subsequent gestation.
The new recommendations have resulted in a change in the categorisation of sows into fat, normal, and skinny at weaning. A fat sow is characterised as having ≥ 15 mm backfat, a normal sow has 12-14 mm backfat, and a skinny sow has ≤ 11 mm backfat.
To track the development in body condition throughout the production cycle, and thereby, secure the sows are on the right feeding curve in the gestation unit, it is recommended to backfat scan the sows a minimum of three times per cycle; at weaning/mating, at 30 days in gestation, and at farrowing.
The importance of correct backfat measurements
Research results and recommendations
The data analysis done in 2021 was based on data originating from 10 feeding trials conducted in three different herds from 2016-2021 with a total of 3,919 DanBred sows and their litters [4]. The included sows were of parity 1st to 5th. Sows were standardised to either 12 (2 trials) or 14 piglets (8 trials) per litter. Sow body weight and backfat were registered at the time of litter standardisation and at weaning. Litter weight was registered at standardisation and at weaning. The weight of dead and removed piglets was registered to calculate litter gain. Sows were grouped in 10 groups according to backfat thickness at farrowing (Millimetre: 9-11, 12, 13, 14, 15, 16, 17, 18, 19-20, 21-26).
It was found that sow body weight and backfat loss increased linearly with increasing backfat thickness at farrowing (P<0.001). Sows with 9 mm backfat lost 1.2 mm backfat and 7.9 kg bodyweight, whereas, sows with 26 mm backfat lost 5.4 mm backfat and 18.4 kg body weight. As shown in Figure 1, the litter weight gain followed a quadratic pattern for both 1st (P=0.02) and 2nd-5th (P<0.001) parity sows. In the interval 12-20 mm backfat, the gain was 2.63-2.69 kg for 1st parity sows and 2.97-3.03 kg for 2nd-5th parity sows. For sows with 9 and 26 mm backfat, the average daily litter weight gain was lower and was at 2.51 kg and 2.48 kg for 1st parity sows, respectively, and 2.84 and 2.82 kg for 2nd to 5th parity sows.
Figure 1: Relationship between backfat thickness at farrowing and average daily litter gain for 1st (- – -) and 2nd – 5th (—-) parity sows
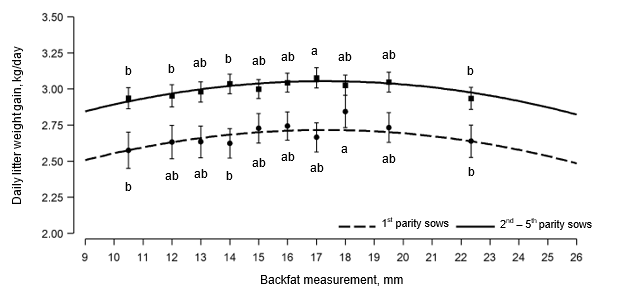
All values marked with = and ■ are LSMEANS values for each group of backfat given with 95 % confidence intervals. The curves are estimated based on all 3,919 litters. LSMEANS values with different letters are significantly different (P<0.05) when evaluated horizontally.
As shown in Figure 2, litter size at weaning also followed a quadratic pattern (P<0.01). Sows with 10-20 mm backfat weaned 12.7-12.8 piglets per litter, whereas sows with 26 mm backfat weaned only 12.3 piglets per litter. 5th parity sows with a backfat thickness of 9-11 and 12 mm had 15 % stillborn of total born compared to 10 % for sows with 13-26 mm backfat (P<0.05). Subsequent reproduction, i.e., the weaning-to-first-service interval, farrowing rate, and total born, was similar across all backfat thicknesses.
Figure 2: Relationship between backfat thickness at farrowing and litter size at weaning for 1st – 5th parity sows.
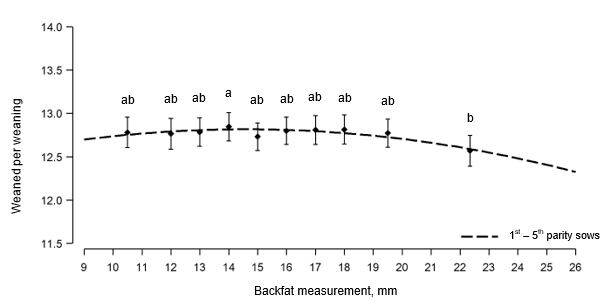
All values marked with = are LSMEANS values for each group of backfat given with 95 % confidence intervals. The curve was estimated based on all 3,919 litters. LSMEANS values with different letters are significantly different (P<0.05).
Based on these results, the recommendation onwards is to aim for a backfat thickness of 14-17 mm at farrowing for DanBred sows.
If the recommended feeding curves and nutritional requirements are followed, the production results will not be affected by the leaner sows. Even better, the sows will consume less feed while restoring optimal body condition compared to the previous recommendations, which means you will save feed costs.
On-farm practical implementation
Backfat scanning of sows
It is recommended to evaluate the backfat thickness of sows and gilts three times per cycle. Sows that are evaluated as skinny at day 30 of gestation may need a fourth evaluation around day 60 of gestation to ensure a positive development of their body condition.
Recommended intervals for backfat scanning:
- At weaning or at mating
- At day 30 in gestation
- At day 60 in gestation, but only sows that were skinny at day 30
- At farrowing
The backfat thickness is measured most efficiently by ultrasound at the P2 point as illustrated in Figure 3.
Figure 3: Procedure for ultrasound backfat scanning – in this case using a Lean-Meater.
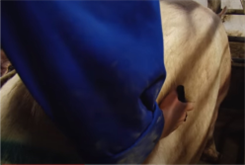
Illustrates the rear point at the last rib.
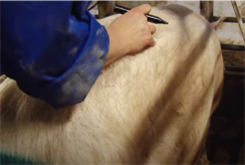
Illustrates how to bring the hand vertically up to the spine in a straight line from the rear point at the last rib.
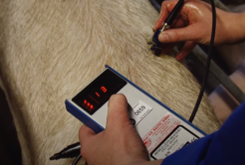
Illustrates measuring 7 cm vertically to the side from the spine, corresponding to the width of the Lean-Meater device. The red dot is the point P2.
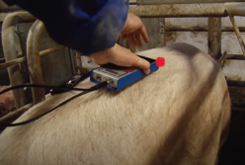
Illustrates the measurement of the backfat thickness at the point P2 by holding the scanner perpendicular to the skin, which has been applied to vegetable oil to give a good contact between the scanner head and the skin. There are three layers of fat on a sow. The three dots show that all 3 fat layers are measured and the backfat thickness in mm can be read.
Recommended feeding curves for gestating sows and gilts
At weaning, sows should be evaluated and categorised into “Fat”, “Normal” or “Skinny” based on the backfat measures [4].
Figure 5: Recommended feeding curves for sows and gilts during gestation
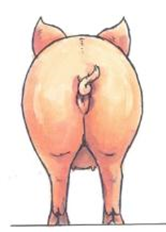
≥ 15 mm backfat
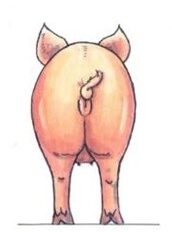
12-14 mm backfat
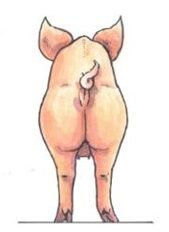
≤ 11 mm backfat
The recommended feeding curves in Table 1 have been adapted to reach the optimal 14-17 mm of backfat at farrowing. When following the feeding curves shown, most sows will be able to regain lost backfat during the first 30 days of gestation. However, it is important to follow the development among the sows throughout gestation to ensure that as many sows as possible are evaluated as being in the normal category (14 – 17 mm backfat) at the time of farrowing.
Table 1: Feeding curves in gestation, kg feed per day1
| Day in gestation | Body condition at weaning or at insemination (P2, mm) | |||
| Fat ≥ 15 mm |
Normal 12-14 mm |
Skinny ≤ 11 mm |
Gilts | |
| Prior to mating | After weaning and until mating all sows are fed 4.3 kg/day | |||
| 0-29 | 2.4 | 2.9 | 4.3 | 2.1 - 2.3 4 |
| 30-84 | 2.2 2 | 2.2 2 | 2.2 (3.3) 3 | 1.9 - 2.6 5 |
| 85-114 | 3.3 | 3.3 | 3.3 | 2.9 - 3.3 |
| 115 | 3.3 | 3.3 | 3.3 | 2.9 - 3.3 |
| Farrowing 6 | 3.3 | 3.3 | 3.3 | 2.9 - 3.3 |
Notes
1 All values are calculated into kg/day on the basis of the Danish Feed Unit system for sows assuming that approx. 9.2 KJ NE/kg = 1.03 FUsow/kg.
2 Maintenance feeding curve incl. physical activity and a safety margin. A sow weighing less than 290 kg will have more feed for growth while the safety margin is not existing for larger (older) sows due to their greater maintenance requirement.
3 If a sow is still skinny at day 30 (<13 mm), then the sow should have a feed allowance of 3.3 kg per day until 14 mm of backfat is reached. For these sows, it is recommended to have an extra backfat scanning at day 60. Sows that have reached a minimum of 13 mm backfat at day 30 are given 2.2 kg per day from day 30-84.
4 It is recommended that gilts be fed moderately for the first four weeks after mating, as a high feed intake above maintenance may increase the risk of fetal loss during implantation. The optimal is to feed the small gilts (140 kg) with 2.1 kg per day and the large gilts (160 kg) with 2.3 kg per day until day 30.
5 Gilts must be fed according to body condition to achieve the desired weight and backfat at farrowing. If the gilts have 13-15 mm backfat at mating (16-17 mm on day 30 in gestation), e.g., 1.9-2.0 FUsow per day is expected to ensure the necessary growth before the first farrowing. If, on the other hand, the gilt has 14-15 mm of backfat on day 30 in gestation, then it must be fed with 2.2 kg per day to increase the backfat thickness marginally. If the gilt is small and skinny at mating, e.g., if there was a need to mate extra gilts in one batch, then it is in the mid-gestation that weight and backfat must be gained, and it is recommended to feed 2.4-2.6 FUsow per day until day 84.
6 Both sows and gilts should have 14-17 mm of backfat at farrowing.
Optimise production and reduce feed costs
You should aim for the recommended 14-17 mm backfat at farrowing. This will reduce the total amount of feed used during gestation, and thus, reduce feed cost for pig producers, without compromising lactation performance.
Remember to follow the development of the sows throughout gestation, by measuring backfat a minimum of three times per cycle; at weaning/mating, at 30 days in gestation, and at farrowing. This procedure will optimise the overall body condition of all sows, as feeding curves can be adjusted according to the sows’ actual needs, optimising the overall herd productivity.
References
[1] Hojgaard, C.K., T.S. Bruun, and P.K. Theil, 2019, Optimal crude protein in diets supplemented with crystalline amino acids fed to high-yielding lactating sows. Journal of Animal Science 97(8): p. 3399–3414.
[2] Hojgaard, C.K., T.S. Bruun, and P.K. Theil, 2019, Optimal lysine in diets for high-yielding lactating sows. Journal of Animal Science: p. 4268–4281.
[3] Strathe, A.V., et al., 2017, Increased dietary protein levels during lactation improved sow and litter performance. Animal Feed Science and Technology. 232: p. 169–181.
[4] Hojgaard, C.K. and T.S. Bruun, 2021, Baggrund for ændring af Anbefalet rygspæktykkelse hos søer omkring faring. SEGES Innovation, Den Rullende Afprøvning, Notat nr. 2130.

